

Why use this query over the customer bookings report in visual?
Well, the answer is too simple. What if you wish to submit a customized report to your upper management with some intuitive graphs and data visualization.
Run the below query in MSSQL and copy paste the results in excel.
Tip: you can also change the “_YEAR” variable to some previous year.
DECLARE @_YEAR AS INT = 2021
SELECT * FROM
(SELECT CO.CUSTOMER_ID, TOTAL_AMT_ORDERED,
CASE WHEN DATEPART(MONTH, CREATE_DATE) = 1 THEN ‘JAN’
WHEN DATEPART(MONTH, CREATE_DATE) = 2 THEN ‘FEB’
WHEN DATEPART(MONTH, CREATE_DATE) = 3 THEN ‘MAR’
WHEN DATEPART(MONTH, CREATE_DATE) = 4 THEN ‘APR’
WHEN DATEPART(MONTH, CREATE_DATE) = 5 THEN ‘MAY’
WHEN DATEPART(MONTH, CREATE_DATE) = 6 THEN ‘JUN’
WHEN DATEPART(MONTH, CREATE_DATE) = 7 THEN ‘JUL’
WHEN DATEPART(MONTH, CREATE_DATE) = 8 THEN ‘AUG’
WHEN DATEPART(MONTH, CREATE_DATE) = 9 THEN ‘SEP’
WHEN DATEPART(MONTH, CREATE_DATE) = 10 THEN ‘OCT’
WHEN DATEPART(MONTH, CREATE_DATE) = 11 THEN ‘NOV’
WHEN DATEPART(MONTH, CREATE_DATE) = 12 THEN ‘DEC’
ELSE ‘NULL’ END AS MONTH1,
CUS.NAME
FROM CUSTOMER_ORDER CO
INNER JOIN CUSTOMER CUS ON CUS.ID = CO.CUSTOMER_ID
WHERE DATEPART(YEAR, CREATE_DATE) = @_YEAR AND STATUS IN (‘R’, ‘F’, ‘C’, ‘H’) ) SRC
PIVOT
( SUM(TOTAL_AMT_ORDERED) FOR MONTH1 IN ([JAN], [FEB], [MAR], [APR], [MAY], [JUN], [JUL], [AUG], [SEP] ,[OCT], [NOV], [DEC]) ) AS PIV;
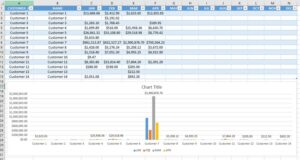
Lets copy the desired output of the query and paste it in excel. Format the data into a table and plot the graphs that makes the most sense.
Automating the above report:
The similar results can also be automated with Excel or POWER Bi. All you need to do is create a “Blank Query” in excel. Once done, click on “Advanced Editor” and copy paste the code below.
Note: Please change the “SERVER” and the “DATABASE” name.
let
Source = Sql.Database(“SERVER_NAME”, “DATABASE_NAME”),
dbo_CUSTOMER_ORDER = Source{[Schema=”dbo”,Item=”CUSTOMER_ORDER”]}[Data],
#”Removed Other Columns” = Table.SelectColumns(dbo_CUSTOMER_ORDER,{“ID”, “CUSTOMER_ID”, “TOTAL_AMT_ORDERED”, “CREATE_DATE”}),
#”Filtered Rows” = Table.SelectRows(#”Removed Other Columns”, each Date.IsInCurrentYear([CREATE_DATE])),
#”Extracted Month Name” = Table.TransformColumns(#”Filtered Rows”, {{“CREATE_DATE”, each Date.MonthName(_), type text}}),
#”Grouped Rows” = Table.Group(#”Extracted Month Name”, {“CUSTOMER_ID”, “CREATE_DATE”}, {{“Total$$”, each List.Sum([TOTAL_AMT_ORDERED]), type number}}),
#”Pivoted Column” = Table.Pivot(#”Grouped Rows”, List.Distinct(#”Grouped Rows”[CREATE_DATE]), “CREATE_DATE”, “Total$$”, List.Sum),
#”Replaced Value” = Table.ReplaceValue(#”Pivoted Column”,null,0,Replacer.ReplaceValue,{“January”, “February”, “March”, “April”}),
#”Changed Type” = Table.TransformColumnTypes(#”Replaced Value”,{{“January”, Currency.Type}, {“February”, Currency.Type}, {“March”, Currency.Type}, {“April”, Currency.Type}})
in
#”Changed Type”
Hit Close and Load. This will achieve the same results.
Well in the same case you can write a Macro to refresh the data connection and load live data. Attach the macro to a button and you are good to go.
Sub Refresh()
ActiveWorkbook.RefreshAll
DoEvents
MsgBox (“Finished Refreshing”)
End Sub
Hope the below template helps.
Total Booking